About Browser Debugger CLI
Browser Debugger CLI is an MCP server published by szymdzum in the Browser category: let Claude Code and other coding agents drive and debug Chrome from the shell. DOM, network, console and raw CDP as short commands, no screenshots and no MCP needed.
The repository has 176 stars and 10 forks, with the last commit 2 hours ago. Recent commit activity is the strongest signal that reported issues will get attention.
Install
git clone https://github.com/szymdzum/browser-debugger-cliThis server has no ConduID identity, so agent calls to it are not receipted. Pin the version you install and review the source before granting it credentials.
Ask AI
Ask AI about Browser Debugger CLI
Powered by Claude · Grounded in docs
Security checks
Static checks derived from the repository 2 hours ago. Heuristics on the source, not an audit.
- ✓README presentThe repository ships documentation.
- ✓License declaredUsable under a stated license.
- ✓Tests presentA test suite exists in the repository.
- ✓Dependencies pinnedA lockfile pins dependency versions.
- !No dynamic code executionSource scan found eval or shell execution. Review how tool inputs reach it before granting credentials.
- !Scoped permissionsDoesn't declare a permission scope. Assume it can do anything its process can.
Releases
README
bdg - Browser Debugger CLI


Give your AI agent a real browser. And the DevTools to go with it.
📖 Wiki: Getting Started · Commands · For AI Agents · Recipes · Quick Reference · Troubleshooting · CLI reference
bdg keeps a browser session open in the background and lets you drive it one shell command at a time. Click, fill, navigate, then read what actually happened: requests, console errors, layout and styles. It is built for coding agents like Claude Code, Codex and Gemini CLI, and it's just as handy in your own terminal. Every command is a plain process with compact output, so it pipes into jq and costs an agent few tokens.
npm install -g browser-debugger-cli
bdg localhost:3000
Two ways to use it
Debug a page: browser telemetry on demand
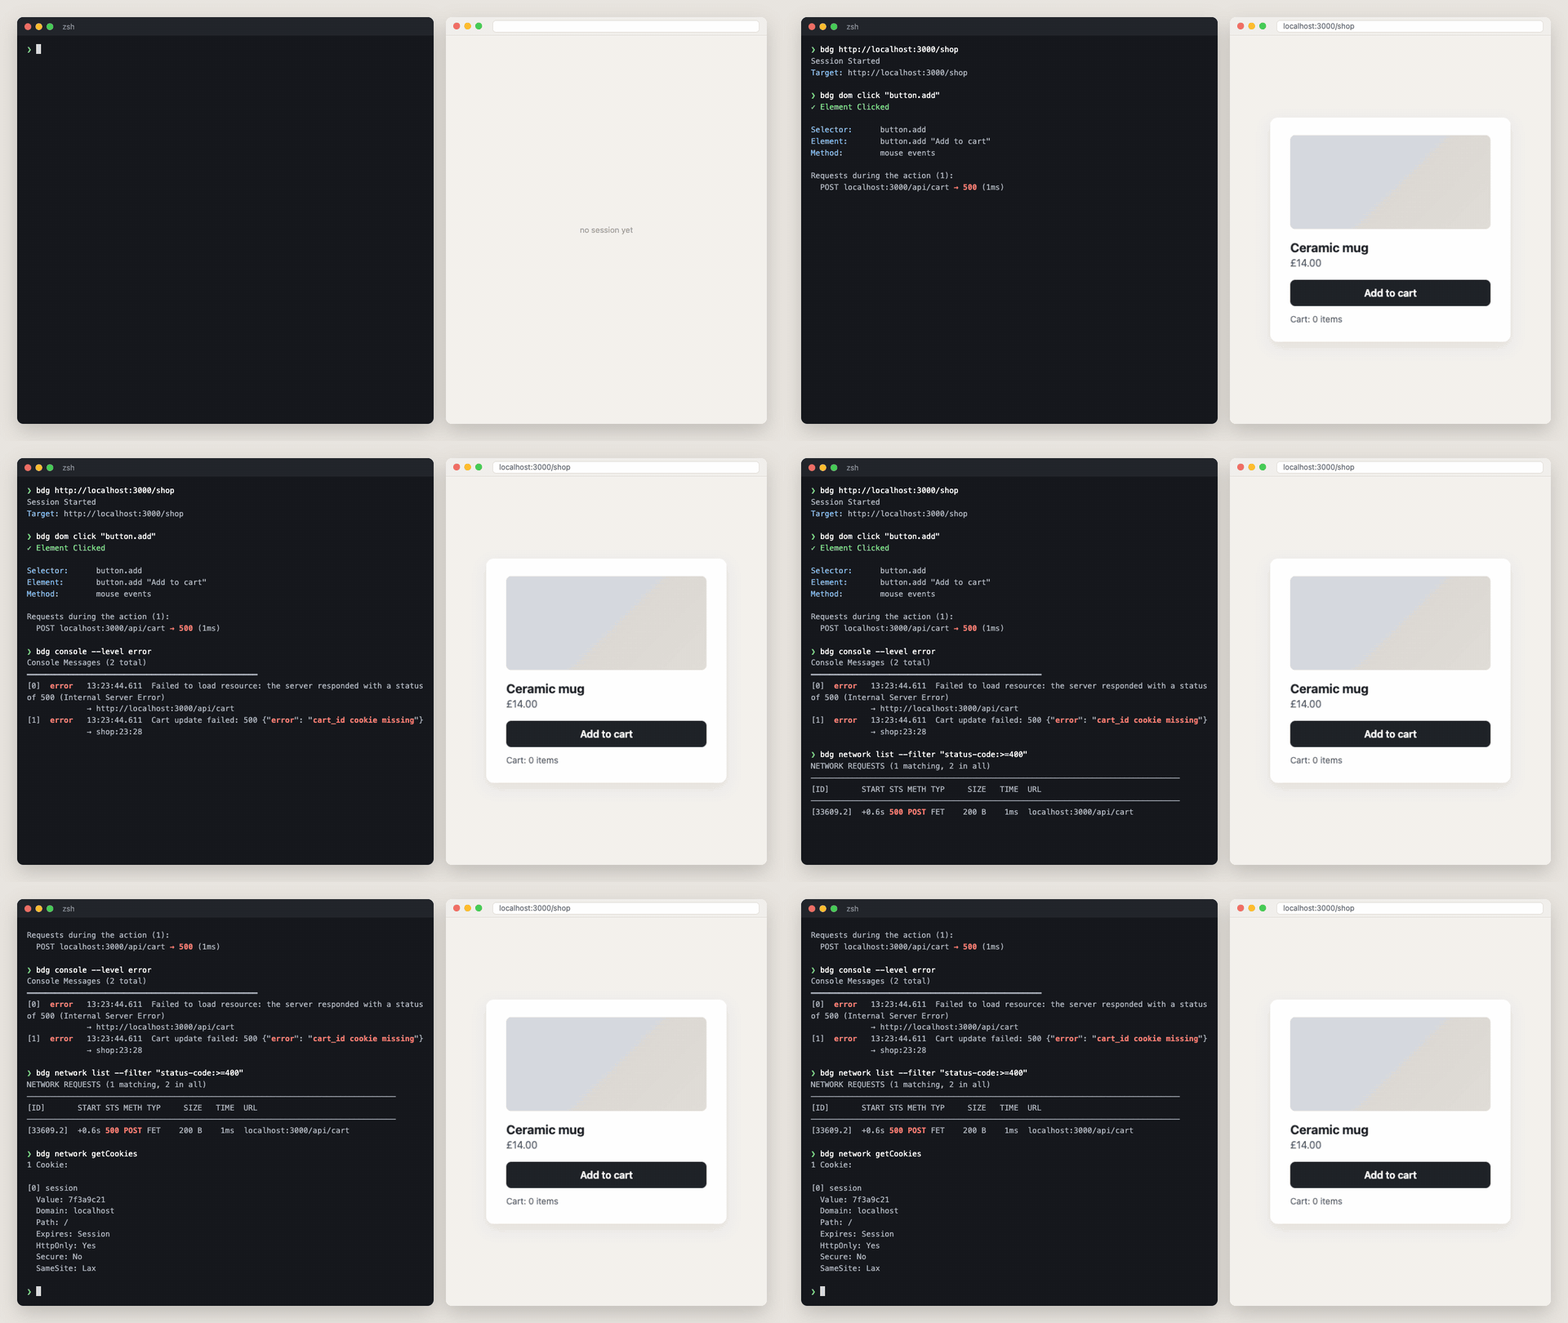
The cart button does nothing, and the page doesn't say why. Three commands later the agent knows: the click fired a POST that returned 500, the console says the cart_id cookie is missing, and the cookie jar confirms it. Network, console, cookies and the DOM are there whenever the agent asks, without a debugger UI.
Automate without writing a script
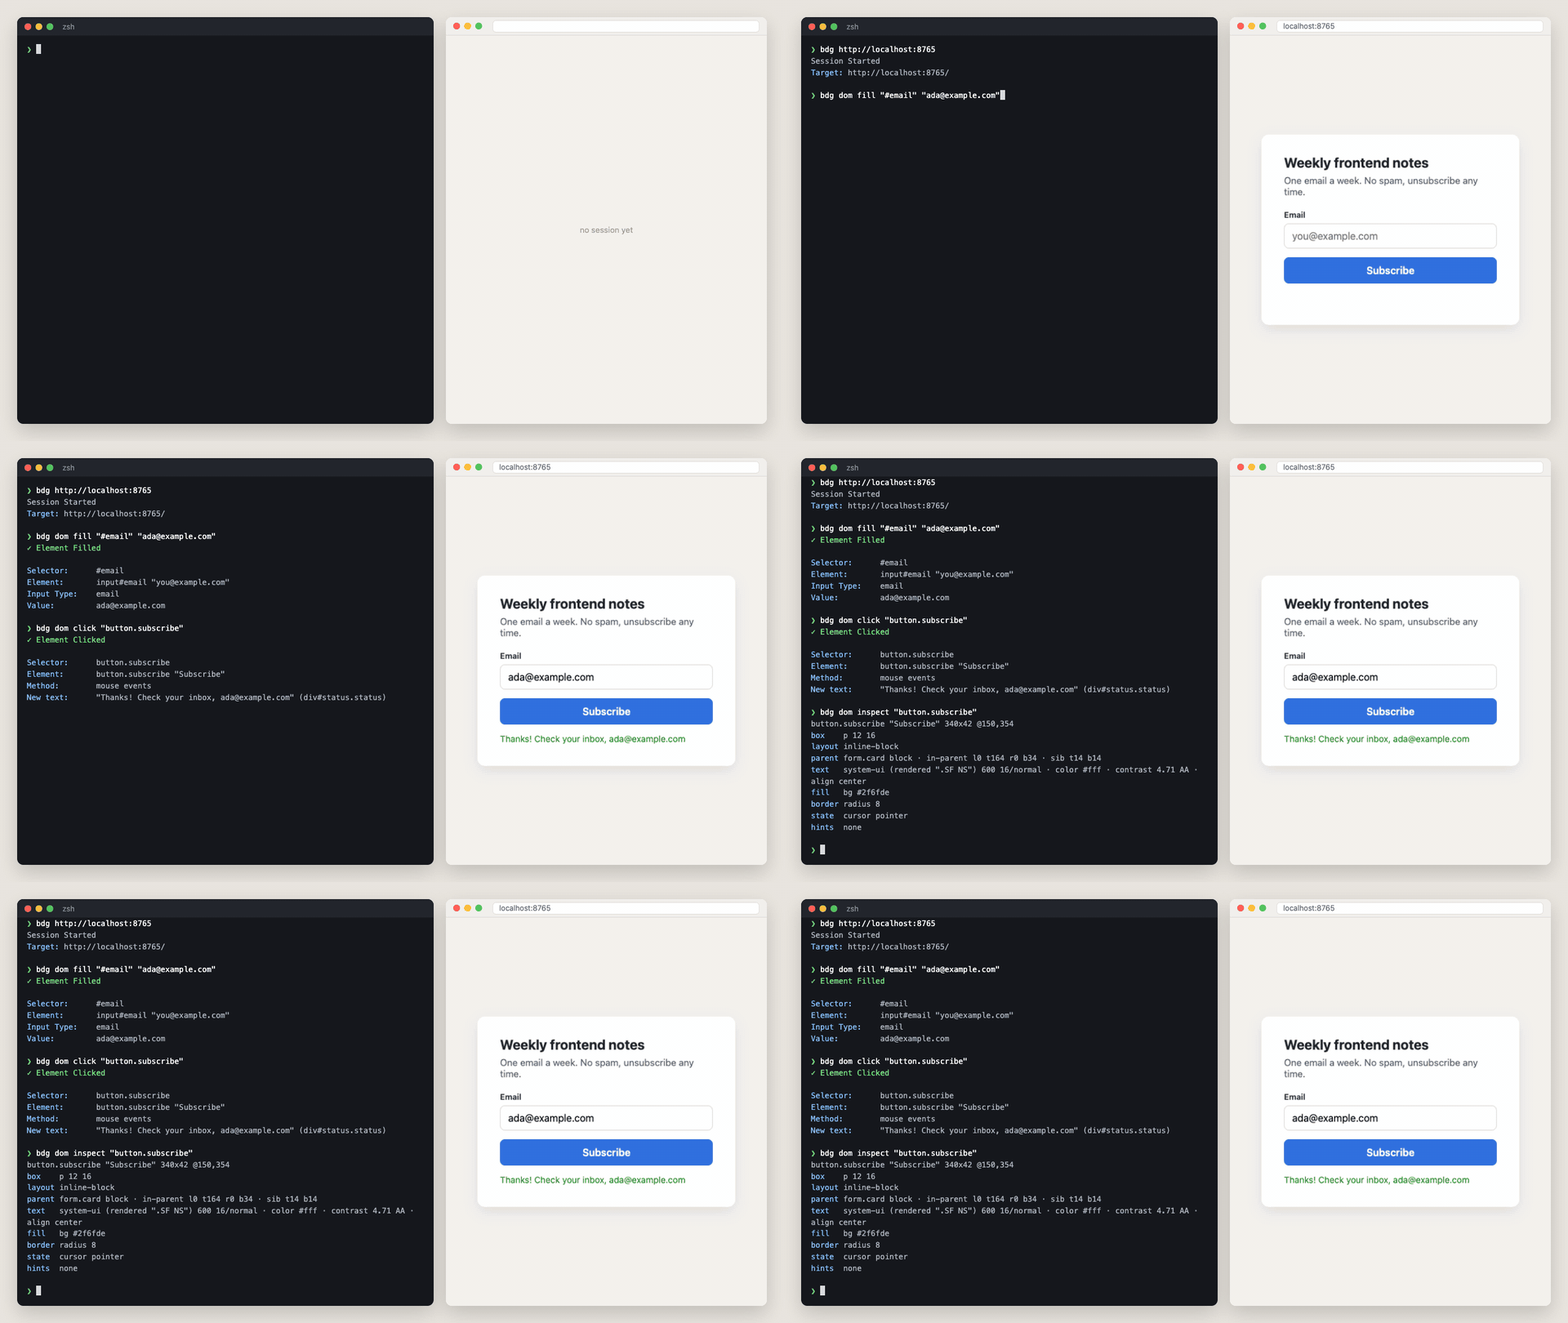
No Playwright script written up front. The agent runs one command, reads what the browser reports back, and picks the next step from that: the click says which text appeared, dom inspect says what the button looks like. When the page does something unexpected, the agent adapts on the spot instead of failing at line 40 of a test.
More examples
Reuse the browser's login from the shell
$ bdg network cookies
1 Cookie:

[0] tp_lax
  Value: cookie-marker-493
  Domain: localhost
  Path: /
  Expires: Session
  HttpOnly: No
  Secure: No
  SameSite: Lax

$ bdg network headers 89565.2 --header authorization
Request Headers:
  Authorization: Bearer eyJhbGciOiJIUzI1NiJ9.eyJzdWIiOiJhZGEifQ.demo

$ bdg eval "localStorage.getItem('access_token')"
eyJhbGciOiJIUzI1NiJ9.eyJzdWIiOiJhZGEifQ.demo
HttpOnly cookies are included, even though the page's own JavaScript can't read them. Log in once in the browser, then reuse the session from the shell:
COOKIES=$(bdg network cookies --json | jq -r '[.data[] | "\(.name)=\(.value)"] | join("; ")')
curl -H "Cookie: $COOKIES" localhost:3000/api/me
The rest of DevTools
$ bdg dom a11y tree
[RootWebArea] "My App" (focused)
  [Heading] "My App"
  [Button] "Sign in" (focusable)
  [Image]                                         ← no accessible name

$ bdg cdp Performance.enable
$ bdg cdp Performance.getMetrics --json | jq '.data.result.metrics | from_entries'
{ "Nodes": 51, "LayoutDuration": 0.000115, "ScriptDuration": 0.000775, "JSHeapUsedSize": 772124, ... }

$ bdg cdp Emulation.setCPUThrottlingRate --params '{"rate":4}'    # Slow CPU
$ bdg cdp Network.emulateNetworkConditions --params '{"offline":false,"latency":400,"downloadThroughput":50000,"uploadThroughput":20000}'
Accessibility, performance metrics, CPU profiling, heap snapshots, code coverage, throttling, storage, service workers: everything Chrome DevTools can do, bdg can do too, through raw CDP. Can't find the method you need? bdg cdp --search heap.
Agents learn it on their own
No docs to paste into the prompt. The agent asks bdg:
bdg --help --json                          # Every command, flag and exit code, plus "task → command" mappings
bdg dom query --help --json                # One command in full: option behaviors, defaults, examples
bdg cdp --search cookie                    # 13 matching methods across all CDP domains, one line each
bdg cdp Network.getCookies --describe      # Parameters, return types, an example call
And when it gets something wrong, bdg tells it what it meant:
$ bdg dom clik "a"
Error: unknown command 'clik'
Did you mean: click?

$ bdg cdp Network.getCookie
Error: Method 'Network.getCookie' not found
Use: bdg cdp --search <keyword> (to search for methods)

Did you mean:
  - Network.getCookies
  - Network.setCookie
  - Network.setCookies

To send it as typed (a method newer than bdg's protocol): bdg cdp Network.getCookie --send-anyway
With --json the same hint is a suggestion field. Each mistake exits with code 81 (invalid arguments), so the agent knows to fix the call rather than retry it. CDP method names are case-insensitive, and raw CDP calls point to the friendlier command when one exists. More in the Agent-Friendly Tools principles bdg follows.
Benchmark: CLI vs MCP
One run of five debugging tasks, from a single JS error up to a memory leak, each done by an AI agent with bdg 0.6.x and with the official Chrome DevTools MCP server as it was in November 2025.
| bdg | Chrome DevTools MCP | |
|---|---|---|
| Score | 77 / 100 | 60 / 100 |
| Tokens used | ~38.1K | ~39.4K |
| Time | 441 s | 323 s |
Token use was about the same and MCP was faster; bdg scored higher on all five tasks, most on the multi-error one (+6). Both tools have changed since: Chrome DevTools MCP has added heap snapshots, Lighthouse audits and CSS styles (it already had performance traces with insights), so the memory task would play out differently today. It still has no HAR export. A refreshed benchmark is tracked in #428. Read the full analysis →
Use it with your agent
bdg ships an agent skill that teaches the workflow: start once, act, read what changed, inspect without screenshots, check network and console.
bdg install-skill            # Claude Code (~/.claude/skills) + Codex, Gemini CLI, ... (~/.agents/skills)
bdg install-skill --claude   # Claude Code only
Start a new agent session afterwards. In Claude Code the skill loads when a task needs a browser, or on demand with /bdg. Re-run bdg install-skill after upgrading bdg.
Quick start
bdg example.com                              # Start a session (the browser stays open)
bdg dom fill 'input[name="q"]' "shoes"       # Interact
bdg dom click 'button:has-text("Search")'
bdg dom wait "#result" --visible             # Wait for an element instead of sleeping
bdg network list --preset errors             # Failed requests
bdg console                                  # Console messages
bdg dom layout "#save"                       # Where is it? Visible? Covered?
bdg dom inspect "#save" --why color          # Which CSS rule sets the color
bdg dom audit contrast                       # Page-wide: text below WCAG AA, weakest first
bdg css search -- --brand                    # Where a token is set, in every stylesheet
bdg dom listeners "#save"                    # Which event listeners run
bdg page emulate --viewport 900x700          # Responsive check mid-session (--mobile for a phone)
bdg eval "document.title"                    # Run JavaScript (--frame for iframes)
bdg cdp Network.getCookies                   # Any CDP method
bdg stop                                     # End the session
Local dev servers with self-signed certificates: bdg https://localhost:5173 --chrome-flags="--ignore-certificate-errors". Need parallel sessions? bdg example.com --session agent2.
What it covers
| Area | Commands |
|---|---|
| Page | navigate, reload, back/forward, viewport, phone (--mobile) and color-scheme emulation |
| Interaction | click (double, right), fill (React-compatible, file inputs), hover, keys, forms, scroll, wait; shadow DOM and iframes included |
| Inspection | element styles with the CSS cascade, layout and visibility, page-wide audits (contrast, overflow, layers, animations, accessibility rules), stylesheet search, accessibility tree, event listeners, screenshots |
| Telemetry | network requests and headers (incl. Authorization), HAR export, cookies (incl. HttpOnly), console messages, live peek --follow |
| Accessibility | accessibility tree, semantic queries (role:button name:Submit), contrast checks |
| Performance | metrics, CPU and heap profiling, tracing, CPU and network throttling (raw CDP) |
| Sessions | several named sessions side by side, or attach to a browser you already have open (bdg attach lists its tabs and attaches to one without reloading it; --chrome-ws-url for a Chrome started with a debugging port) |
| Everything else | raw CDP: bdg cdp --list, --search, --describe |
The CLI reference documents every command. bdg --help --json gives agents the machine-readable version.
Install
Requirements: Node.js 22.12+ and a Chromium-based browser: Chrome, Chromium or Microsoft Edge.
Platforms: macOS, Linux and Windows via WSL. Native PowerShell and Git Bash are not supported yet.
Browsers: bdg launches Chrome by default. To use Edge, point CHROME_PATH at its binary, or attach to an Edge you started with --remote-debugging-port:
CHROME_PATH="/Applications/Microsoft Edge.app/Contents/MacOS/Microsoft Edge" bdg example.com   # macOS
CHROME_PATH=/usr/bin/microsoft-edge bdg example.com                                         # Linux
bdg example.com --chrome-ws-url 9222                                                        # Open a URL in a running browser
Your everyday Chrome: enable remote debugging at chrome://inspect/#remote-debugging, then bdg attach lists its tabs and bdg attach checkout starts a session on one as it is (no reload; Chrome asks you to allow each connection). --user-data-dir <dir> picks another profile (Canary, Edge, Brave).
Firefox and Safari are not supported: bdg speaks the Chrome DevTools Protocol, which they do not implement.
When to use something else
- Playwright / Puppeteer: long scripted test suites and a mature testing ecosystem.
- Chrome DevTools MCP: if your setup is built around MCP servers, or you want its Lighthouse audits, performance trace insights and heap snapshot analysis tools.
bdg is for when an agent or a developer needs to poke at a live page, step by step, and understand what is going on.
Contributing
Issues for bugs, Discussions for ideas. PRs welcome. See the Architecture page and docs/ for contributor guides.
License
MIT
README fetched from the repository 2 hours ago. The original is authoritative.