
io.github.es617/dbgprobe-mcp-server
Let AI agents interact with debug probes — connect, flash, read/write memory, and reset.
Ask AI about io.github.es617/dbgprobe-mcp-server
Powered by Claude · Grounded in docs
I know everything about io.github.es617/dbgprobe-mcp-server. Ask me about installation, configuration, usage, or troubleshooting.
0/500
Reviews
Documentation
Debug Probe MCP Server
![]()
![]()
A stateful debug probe Model Context Protocol (MCP) server for developer tooling and AI agents. Works out of the box with Claude Code, VS Code with Copilot, and any MCP-compatible runtime. Communicates over stdio and drives on-chip debug probes (J-Link first, OpenOCD and pyOCD planned) to flash, debug, and inspect embedded targets.
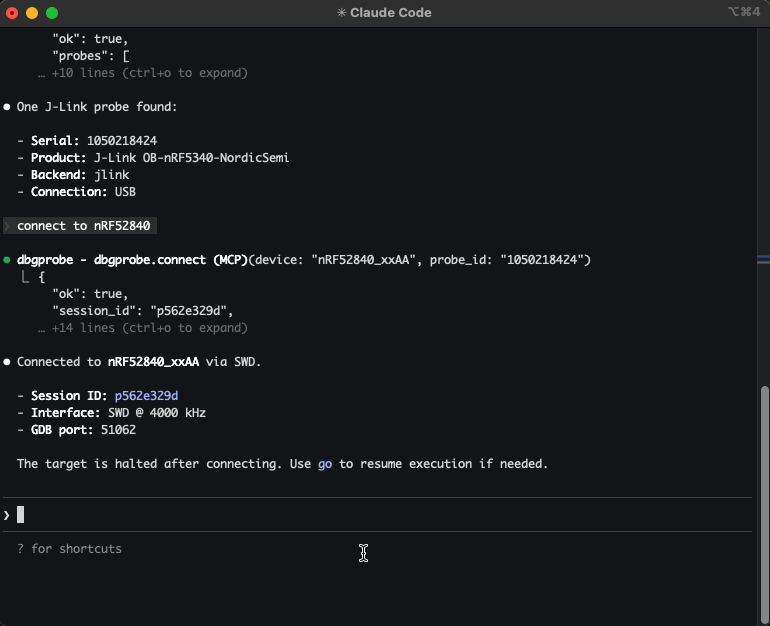
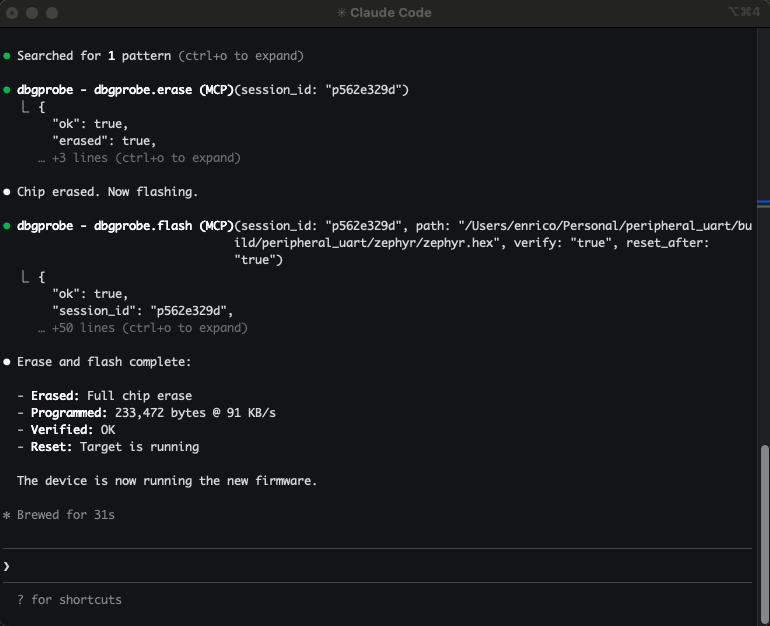
Example: Let Claude Code list attached J-Link probes, connect to your nRF52840, flash a new firmware, read memory, and reset the target — all conversationally.
Demo
Video walkthrough — connecting to a J-Link probe, flashing firmware, loading ELF and SVD for symbol-aware debugging, RTT logging, and breakpoints.
Why this exists
If you've ever typed J-Link Commander commands by hand, copy-pasted memory addresses between a datasheet and a terminal, re-flashed the same firmware 20 times during a debug session, and juggled multiple tool windows — this is for you.
You have a microcontroller on a debug probe. You want an AI agent to interact with it — connect, flash firmware, read/write memory, reset, halt, resume. This server makes that possible.
It gives any MCP-compatible agent a full set of debug probe tools. The agent calls these tools, gets structured JSON back, and reasons about what to do next — without you manually driving JLinkExe for every operation.
What agents can do with it:
- Flash and iterate — build firmware, flash it, reset, check behavior — all in one conversation
- Inspect memory — read peripheral registers, check RAM contents, verify flash writes
- Debug interactively — halt, step, set breakpoints, inspect state, resume
- Automate test flows — flash → reset → read output → validate
- Multi-probe setups — connect to multiple probes simultaneously, each with its own session
Who is this for?
- Embedded engineers — faster iteration: flash, debug, inspect memory conversationally
- Hobbyists and makers — interact with microcontrollers without learning JLinkExe command syntax
- QA and test engineers — automated flash-and-test sequences across multiple boards
- Researchers — systematic exploration of embedded systems, register inspection
Quickstart (Claude Code)
pip install dbgprobe-mcp-server

# Register the MCP server with Claude Code
claude mcp add dbgprobe -- dbgprobe_mcp

# Or with explicit J-Link path
claude mcp add dbgprobe \
  -e DBGPROBE_JLINK_PATH=/Applications/SEGGER/JLink/JLinkExe \
  -- dbgprobe_mcp
Then in Claude Code, try:
"List attached debug probes, connect to the J-Link, and read 16 bytes from address 0x20000000."
Supported backends
| Backend | Status | Probe hardware |
|---|---|---|
| J-Link | Working (v0) | SEGGER J-Link (EDU, EDU Mini, PLUS, PRO, etc.) |
| OpenOCD | Planned | ST-Link, CMSIS-DAP, and many others |
| pyOCD | Planned | CMSIS-DAP, ST-Link, J-Link (via pyOCD) |
The server is backend-agnostic — tool names (dbgprobe.*) stay the same regardless of which probe you use.
J-Link requirements
Install the SEGGER J-Link Software Pack. The server auto-detects JLinkExe on PATH or in common install locations:
- macOS:
/Applications/SEGGER/JLink/ - Linux:
/opt/SEGGER/JLink/,/usr/bin/ - Windows:
C:\Program Files\SEGGER\JLink\
Or set DBGPROBE_JLINK_PATH to point to the executable directly.
This project is not affiliated with or sponsored by SEGGER. J-Link is used because it's widely available and well-supported.
Tools
| Category | Tools |
|---|---|
| Probe | dbgprobe.probes.list, dbgprobe.connect, dbgprobe.erase, dbgprobe.disconnect, dbgprobe.reset, dbgprobe.halt, dbgprobe.go, dbgprobe.step, dbgprobe.status, dbgprobe.flash, dbgprobe.mem.read, dbgprobe.mem.write, dbgprobe.breakpoint.set, dbgprobe.breakpoint.clear, dbgprobe.breakpoint.list |
| Introspection | dbgprobe.connections.list |
| ELF | dbgprobe.elf.attach, dbgprobe.elf.info, dbgprobe.elf.lookup, dbgprobe.elf.symbols |
| SVD | dbgprobe.svd.attach, dbgprobe.svd.info, dbgprobe.svd.read, dbgprobe.svd.write, dbgprobe.svd.set_field, dbgprobe.svd.update_fields, dbgprobe.svd.list_peripherals, dbgprobe.svd.list_registers, dbgprobe.svd.list_fields, dbgprobe.svd.describe |
| RTT | dbgprobe.rtt.start, dbgprobe.rtt.stop, dbgprobe.rtt.read, dbgprobe.rtt.write, dbgprobe.rtt.status |
| Plugins | dbgprobe.plugin.list, dbgprobe.plugin.template, dbgprobe.plugin.load, dbgprobe.plugin.reload |
| Tracing | dbgprobe.trace.status, dbgprobe.trace.tail |
See docs/tools.md for full schemas and examples.
Install (development)
# Editable install from repo root
pip install -e ".[test]"

# Or with uv
uv pip install -e ".[test]"
MCP is a protocol — this server works with any MCP-compatible client. Below are setup instructions for the most common ones.
Add to Claude Code
# Standard setup
claude mcp add dbgprobe -- dbgprobe_mcp

# With default target device
claude mcp add dbgprobe \
  -e DBGPROBE_JLINK_DEVICE=nRF52840_xxAA \
  -- dbgprobe_mcp

# Debug logging
claude mcp add dbgprobe -e DBGPROBE_MCP_LOG_LEVEL=DEBUG -- dbgprobe_mcp
Add to VS Code / Copilot
Add to your project's .vscode/mcp.json (or create it):
{
  "servers": {
    "dbgprobe": {
      "type": "stdio",
      "command": "dbgprobe_mcp",
      "args": [],
      "env": {
        "DBGPROBE_JLINK_DEVICE": "nRF52840_xxAA"
      }
    }
  }
}
Adjust env to match your target — set DBGPROBE_JLINK_DEVICE to your chip, or remove it to specify the device at connect time.
Add to Cursor
Add to your project's .cursor/mcp.json (or create it). Cursor does not support dots in tool names, so DBGPROBE_MCP_TOOL_SEPARATOR must be set to _:
{
  "mcpServers": {
    "dbgprobe": {
      "command": "dbgprobe_mcp",
      "args": [],
      "env": {
        "DBGPROBE_JLINK_DEVICE": "nRF52840_xxAA",
        "DBGPROBE_MCP_TOOL_SEPARATOR": "_"
      }
    }
  }
}
Environment variables
Server
| Variable | Default | Description |
|---|---|---|
DBGPROBE_BACKEND | jlink | Debug probe backend. Future: openocd, pyocd. |
DBGPROBE_MCP_LOG_LEVEL | WARNING | Python log level (DEBUG, INFO, WARNING, ERROR). Logs go to stderr. |
DBGPROBE_MCP_TRACE | enabled | JSONL tracing of every tool call. Set to 0, false, or no to disable. |
DBGPROBE_MCP_TRACE_PAYLOADS | disabled | Include memory data payloads in traced args (stripped by default). |
DBGPROBE_MCP_TRACE_MAX_BYTES | 16384 | Max payload chars before truncation (only when TRACE_PAYLOADS is on). |
DBGPROBE_MCP_TOOL_SEPARATOR | . | Character used to separate tool name segments. Set to _ for MCP clients that reject dots in tool names (e.g. Cursor). |
DBGPROBE_MCP_PLUGINS | disabled | Plugin policy: all or comma-separated plugin names (e.g. nrf52,stm32). |
J-Link backend
| Variable | Default | Description |
|---|---|---|
DBGPROBE_JLINK_PATH | auto-detect | Explicit path to JLinkExe (or JLink.exe on Windows). |
DBGPROBE_JLINK_GDBSERVER_PATH | auto-detect | Explicit path to JLinkGDBServerCLExe. |
DBGPROBE_JLINK_DEVICE | (none) | Default target device string (e.g. nRF52840_xxAA). Can be overridden per-session. |
DBGPROBE_INTERFACE | SWD | Debug interface: SWD or JTAG. |
DBGPROBE_SPEED_KHZ | 4000 | Interface clock speed in kHz. |
DBGPROBE_GDB_TRACE | disabled | Log all GDB RSP packets to file. Set to 1, true, or yes to enable. |
DBGPROBE_GDB_TRACE_FILE | /tmp/gdb_trace.log | Path for GDB RSP trace log (only when GDB_TRACE is on). |
ELF Support
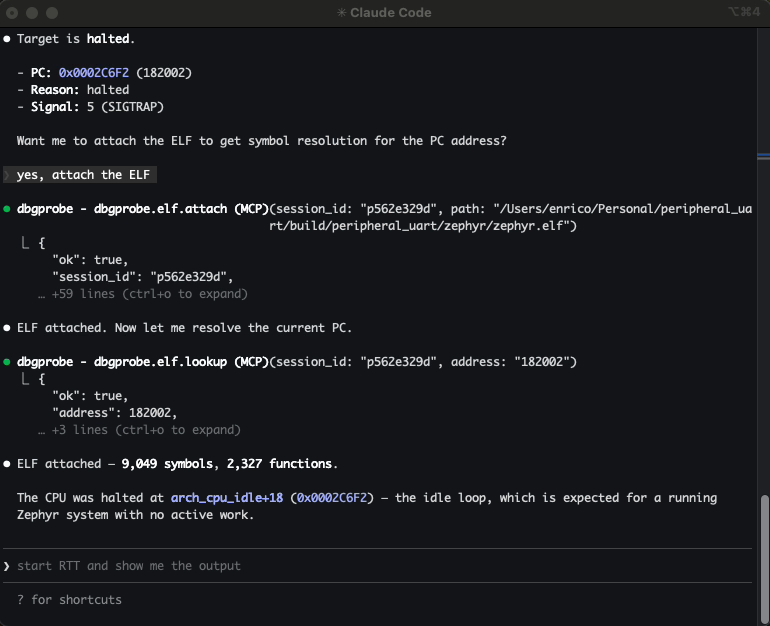
Attach an ELF file to a session to enable symbol-aware debugging:
- Symbol lookup — resolve function names to addresses and vice versa
- Breakpoints by name —
breakpoint.set(symbol="main")instead of raw addresses - Auto-enriched responses —
status,step, andhaltincludesymbol+symbol_offsetwhen an ELF is attached - Flash integration — flashing an
.elfauto-attaches it; flashing.hex/.binauto-reloads a previously attached ELF; sibling.elffiles are suggested via hints
> "Attach the ELF, set a breakpoint on main, run, and show me where it halted."
The agent calls elf.attach, breakpoint.set(symbol="main"), go, then status — and gets back "halted at main+0" instead of a raw hex address.

SVD Support
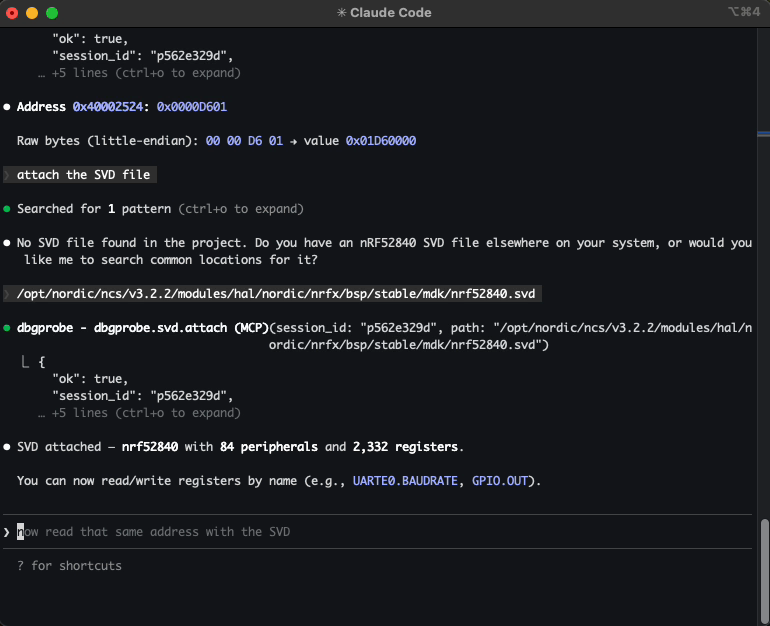
Attach an SVD (System View Description) file to a session to enable register-level peripheral access:
- Named register reads —
svd.read("GPIO.OUT")returns the raw value and all decoded fields with enum names - Field-level reads —
svd.read("GPIO.PIN_CNF[3].PULL")returns the field value and enum name ("PullUp") - Safe field writes —
svd.set_field("GPIO.PIN_CNF[3].PULL", "PullUp")does read-modify-write - Batch field updates —
svd.update_fields("GPIO.PIN_CNF[3]", {"DIR": "Output", "PULL": "PullUp"})— one read, one write - Raw register writes —
svd.write("GPIO.OUT", 0x01)— full register, no RMW - Discovery — list peripherals, registers, fields; describe with enums
- Auto-decode on mem.read — when an SVD is attached and
mem.readhits a known register address, the response includes decoded fields
> "Attach the SVD, read GPIO.PIN_CNF[3], and set PULL to PullUp."
The agent calls svd.attach, svd.read("GPIO.PIN_CNF[3]"), then svd.set_field("GPIO.PIN_CNF[3].PULL", "PullUp") — and gets back decoded field values instead of raw hex.
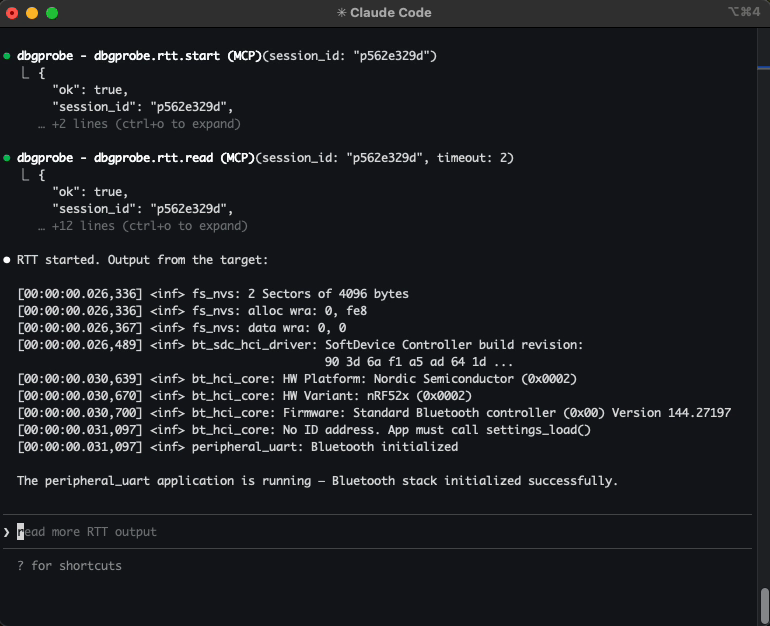
RTT (Real-Time Transfer)
Start, stop, read, and write to SEGGER RTT channels. The agent can stream target log output and send data to the device — useful for debugging firmware that prints over RTT instead of UART.
> "Start RTT and show me the output."
For repetitive flows — read device ID, run a self-test sequence, validate calibration — you can package them as plugins: Python modules that expose custom tools the agent can call directly. Enable with DBGPROBE_MCP_PLUGINS=all. See the nrf52_info example.
Tracing
Every tool call is traced to .dbgprobe_mcp/traces/trace.jsonl and an in-memory ring buffer (last 2000 events). Tracing is on by default — set DBGPROBE_MCP_TRACE=0 to disable.
Use dbgprobe.trace.status and dbgprobe.trace.tail to inspect the trace without reading the file directly.
Try without an agent
You can test the server interactively using the MCP Inspector:
npx @modelcontextprotocol/inspector python -m dbgprobe_mcp_server
Roadmap / TODO
- OpenOCD backend — support ST-Link, CMSIS-DAP, and other probes via OpenOCD subprocess
- pyOCD backend — native Python probe access via pyOCD library
- Multi-core support — target specific cores on multi-core SoCs
- Cortex-A/R support — ARM-mode breakpoints (
kind=4); currently Thumb-only (Cortex-M)
Known limitations
- Single-client only. The server handles one MCP session at a time (stdio transport).
- RTT channel 0 only. RTT support is limited to channel 0 (terminal). Multi-channel RTT is a future enhancement.
- Flash clears breakpoints. Flashing new firmware invalidates breakpoints (the code at those addresses may have changed). The session stays alive but breakpoints are cleared.
- Cortex-M only. Breakpoints use Thumb-mode (
kind=2). Cortex-A/R targets (ARM-mode,kind=4) are not yet supported. - Instruction-level step only.
dbgprobe.stepsingle-steps one CPU instruction. Source-level stepping (step into/over/out) is not supported.
Safety
This server connects an AI agent to real debug hardware. That's the point — and it means the stakes are higher than pure-software tools.
Plugins execute arbitrary code. When plugins are enabled, the agent can create and run Python code on your machine with full server privileges. Review agent-generated plugins before loading them.
Writes affect real hardware. A bad memory write or flash operation can brick a device, wipe calibration data, or trigger unintended behavior. Consider what the agent can reach.
Use tool approval deliberately. When your MCP client prompts you to approve a tool call, consider whether you want to allow it once or always.
This software is provided as-is under the MIT License. You are responsible for what the agent does with your hardware.
License
This project is licensed under the MIT License — see LICENSE for details.